Network Visualization
Enterprise Networking & Security Visualization
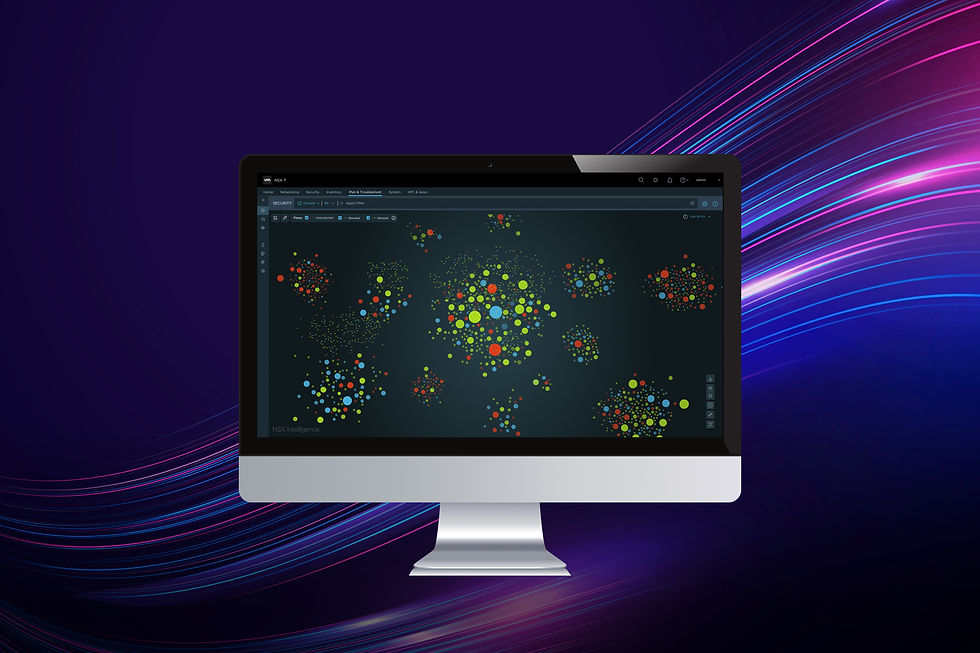
NSX INTELLIGENCE
NSX Intelligence is the core of VMware networking and security product. NSX Intelligence provides a graphical user interface to visualize the security posture and network traffic flows that have occurred in your on-premises NSX-T Data Center environment.
Scope
Problem framing
Concept design
Validation
User testing
Implementation
Duration
July 2019 - July 2020
My Role -
Lead Designer
UI UX design
Design strategy
User Research
Design handoff
WHAT'S THE CONTEXT?
NSX Intelligence had its first version released and was working on enhancing the overall visualization for the 2.0 version. We wanted to improve the main visualization to support our large environment customers by providing the galactic view as well as provide enhancements on the existing issues reported from customers.
THE CHALLENGE
-
Scalability: small environments (up to 2K VMs, 250K flows) vs. large environment (up to 5K VMs, +500K flows)
-
Prioritizing information (location, grouping, threat information, discoverability of VMs, flow information, etc..)
-
Closing gaps in interaction & visualizing workloads
-
Information readability
-
Meeting Accessibility standard (WCAG 2.1)
-
Delivering correct information about live traffic
-
Distinguishing filter results in the visualization
-
Overloading the system & performance issues
Process
Persona and Use Case
Defining who the primary persona is and identifying what user goals to be achieved
Customer Feedback
Understanding what the pain points are and defining the scope of the request from feedbacks gathered from user interviews/sessions
Competitor Analysis
Identify the existing competitors and examine how other products solved the problems and try to understand why it was done that way
Concept Design
Work on the concept designs based on the requirements provided by PMs. These can be very high-level designs taking account of the future of this product in an ideal state as a whole rather than focusing on what's feasible in this time frame.
Validation
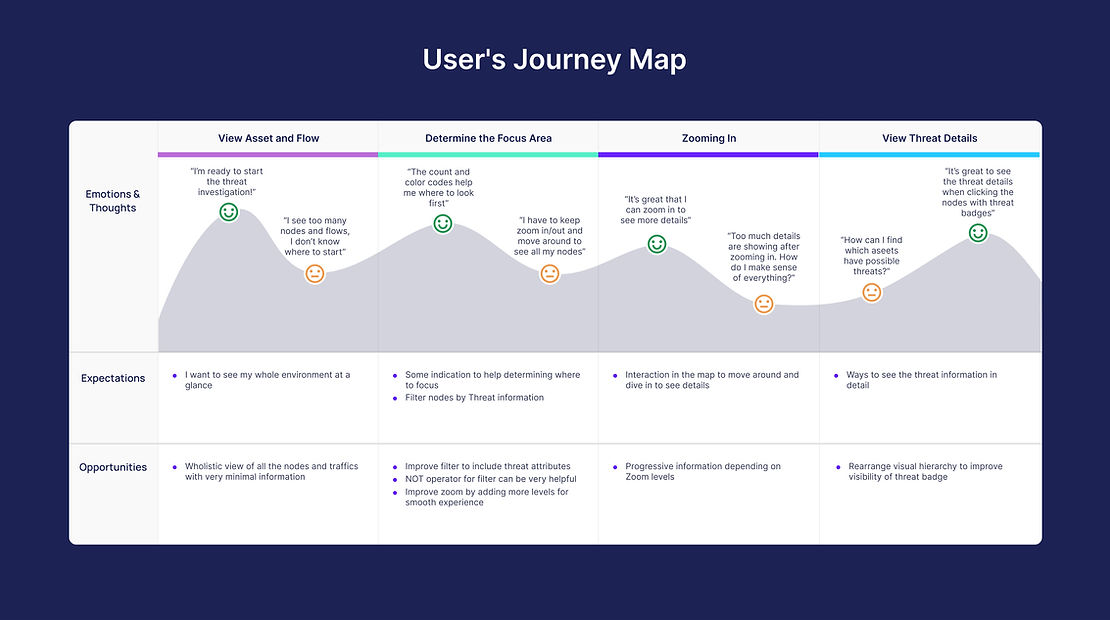
The validation of the problem happens multiple times in the process. We sometimes use WIP mockups to get early feedback from customers to check whether the updated workflow is aligned to their expectations and what we can do to make it better. We often have a walkthrough with our customers over the call, or use company events like VMworld to have small group user sessions. These opportunities are very important as we can validate our concept designs early, and/or understand what pain points the customers are having by using our current designs.
Reviews
Multiple reviews with a different set of reviewers to get feedbacks and solidify the design. First with smaller set of designers, and then expand to PMs, QEs, and Engineers until getting the approvals from key stakeholders.
Final Touch
Checking all the details on interactions, visuals, and behaviors implemented works as designed. This is very crucial for designer to identify the smallest details possible and check for consistency throughout before it is sent for testing.
UX Research

USERS
The security admin is the primaryuser who creates & updates firewall rules. The main goal for the security admins is to protect the environment by creating allow/block traffic flow rules and reducing the number of unprotected flows by optimizing the rules. NSX Intelligence visualization is the tool for viewing the live traffic information between the assets that also displays threat information as well as a way to get recommendations for optimization.
USER SESSIONS
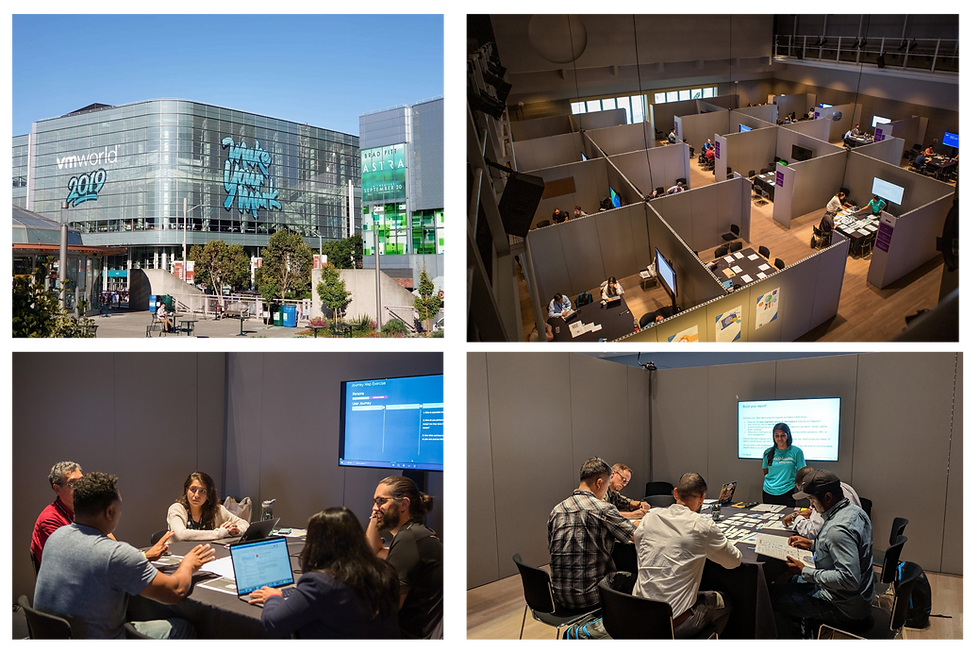
We went through the existing customer feedback list to identify the main problem and what needs to be solved. Also, we conducted several customer calls to confirm those problems as well as conducted the usability testing at VMworld Design Studio. It was a great opportunity to meet our existing & potential customers in person and learn/validate workflows on how they use our product.
USER FEEDBACK
Identifying the problem in a customer environment where the scale is large.
The problems we noticed are:
-
Too many flows between workloads that users are not able to make concrete decisions where to focus
-
Not being able to click each flow
-
Performance issues
-
Visual clutterness
 feedback2.jpg |  feedback4.jpg |  feedback5.png |
|---|
Design Process
VALIDATING THE PROBLEM
After reviewing the feedback, reached out to the customers to discuss the problem in detail. This helped in setting the right goal and how to prioritize the work.
SETTING UP THE GOALS
We finalized 2 main goals:
-
Visual hierarchy & clean up: Progressive disclosure of information depending on the viewable area
-
Improve interaction: Defining zoom levels and interactions for seamless zooming experience
KPIs (Success Metric)
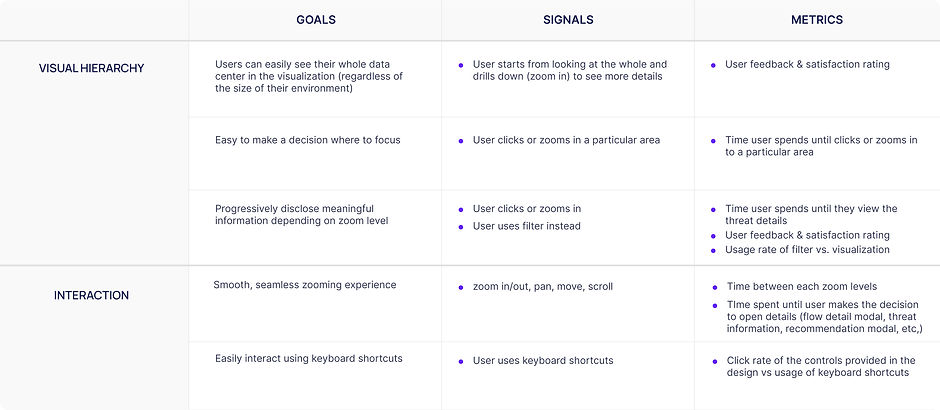
It is very important to define what metrics we can use to measure successes/failures we will get from this project.
I partnered with PMs and Engineers to define the KPIs using the framework below.
COMPETITOR ANALYSIS
Learning how other companies address and respond to the same problem helps in making more accurate decisions on how we want to solve the problem. For enhancing the visualization for large-scale environments, we looked at most leading competitors in this market including ExtraHop, Vectra.AI, Cybereason, Red Canary, Secureworks, and Google Maps for multi-zoom level interactions.


ExtraHop
Live activity Map
Threat anomalies
Machine learning-initiated workflows
3D Interaction
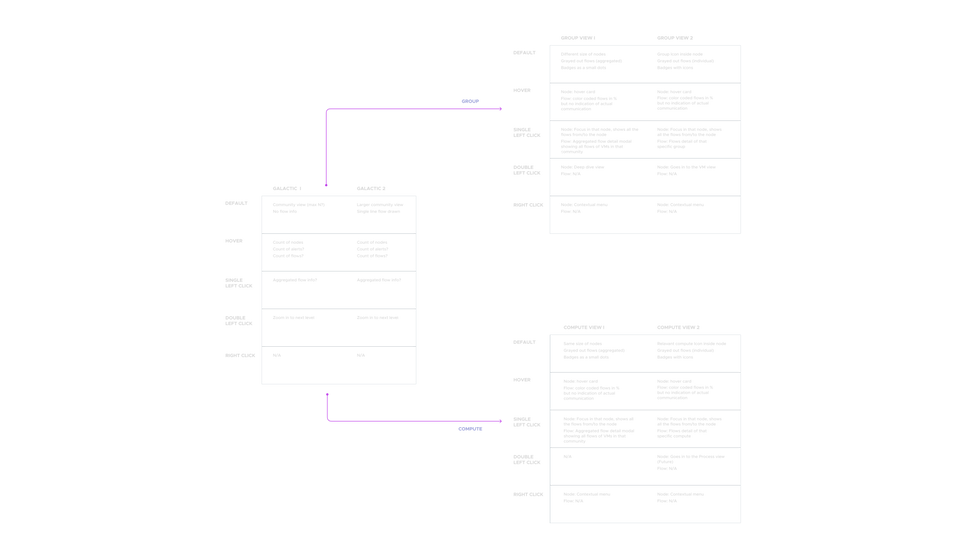
Vectra AI
No global network monitoring map
Showing assets/traffic at Campaign level
2D visualization at asset level
Cortex XDR
Firewalls & endpoint data in the map
Aggregated group viz with world map
Protocol information
Granularity down to process information
EXPLORATION


INFO ARCH
Determining the zoom levels and what information to show on each zoom levels
ITERATIONS
After internally reviewing the options, we defined the information we show on each zoom level. This phase is to iterate and update the mockups to do further user testing with customers.


CUSTOMER FEEDBACK & MORE ITERATION
I took the initial concept screens to several customers including those who raised the issue. We tested using one of the customer's environment setups and found some additional issues and areas where we can improve.
-
Still, the color-coded flows look busy and it's hard to read the Groups/VM names
-
Confirmed the keyboard shortcuts will help
-
Process information (one more level down from VM view) will be great


PROTOTYPE
Galactic View (light)


Galactic View (light)

Galactic View (dark)
IMPACT
We used the success metrics we set in the beginning to measure the impact. We tested 12 users including VMware IT/SOC person, existing and potential customers.
Visual Hierarchy:
-
Time spent to do the first click to zoom decreased by 20%
-
Time spent on accessing the threat details decreased by 35%
-
Usage of filters decreased by 6%
Interactions:
-
The time in loading real data is the same but for customers, it seems like it's loading faster since the abstract layer was introduced and the real data calculation already started even though users view the abstract layers. BIG PLUS!!
-
CSAT score increased by 12%
WHAT'S NEXT...
-
Add process information one step further from VM level
-
More zoom levels in between
-
Aggregated information in the side panel even for the community view
-
Improve performance
-
Highlighting the filtered nodes and communications
-
Adding more threat information (file detections, IDPS, etc.)
-
Show nested group layers